Understanding Your Studio Analytics
PixoProof Academy: Understanding PixoProof Analytics: Opens, Selections and Storage
Analytics gives you a business view of your studio: how many albums and photos you are adding, how clients respond to their galleries, how much storage you use, and how many invited clients go on to submit selections.
Opening Analytics
- In the left sidebar, click Analytics.
- The page opens on the Overview tab. Use the tabs under the page header to switch between Overview, Albums, Client Activity, Storage, and Selections.
Choosing a Time Range
The buttons in the top-right corner of the page set the period the numbers cover:
- 7D — the last 7 days
- 30D — the last 30 days
- 90D — the last 90 days
- 1Y — the last year
Each tab starts on 7D when you open it. The range counts back from the current moment, so 7D means "the last 7 × 24 hours", not "this calendar week".
If nothing happened in the selected period, the tab shows an empty state (for example "No activity in the last 7 days"). Pick a wider range to see older activity.
Overview Tab
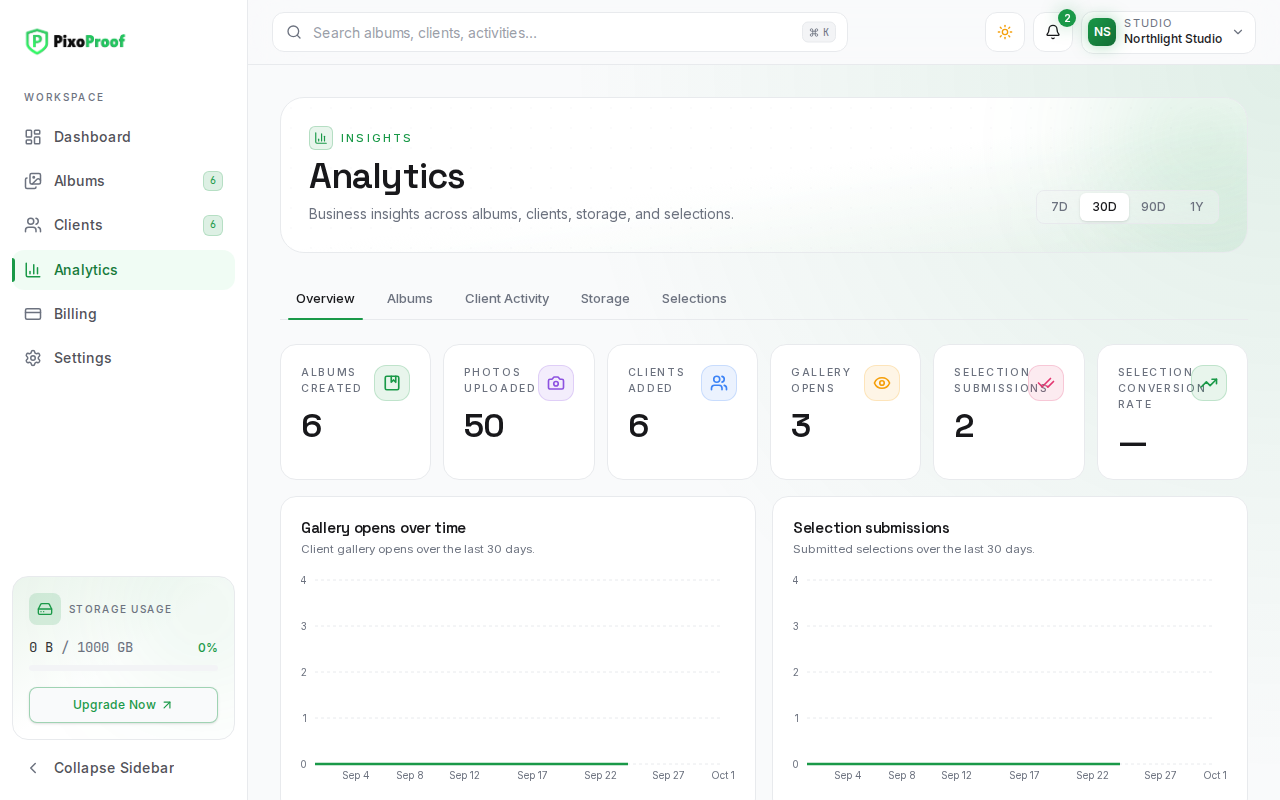
Summary Tiles
Six tiles summarise the selected period:
- Albums Created — albums you created during the period. Archived albums are not counted.
- Photos Uploaded — photos uploaded during the period that have finished processing.
- Clients Added — clients added to your client list during the period.
- Gallery Opens — clients who opened a gallery during the period. Each client is counted once per album, based on their most recent visit, so a client who opens the same gallery five times counts as one.
- Selection Submissions — selection lists clients submitted during the period.
- Selection Conversion Rate — Selection Submissions divided by the number of client invitations sent during the same period, shown as a percentage. It shows — when no invitations were sent in the period. Because it compares two counts from the same window, it can occasionally go above 100% (for example, when clients invited before the period submit during it).
Charts
- Gallery opens over time — the number of gallery opens per day across the period.
- Selection submissions — the number of submitted selections per day across the period.
Days are grouped by date in UTC. A chart with no activity shows "No analytics data yet".
Albums Tab
The Album analytics table lists your albums with their numbers for the selected period.
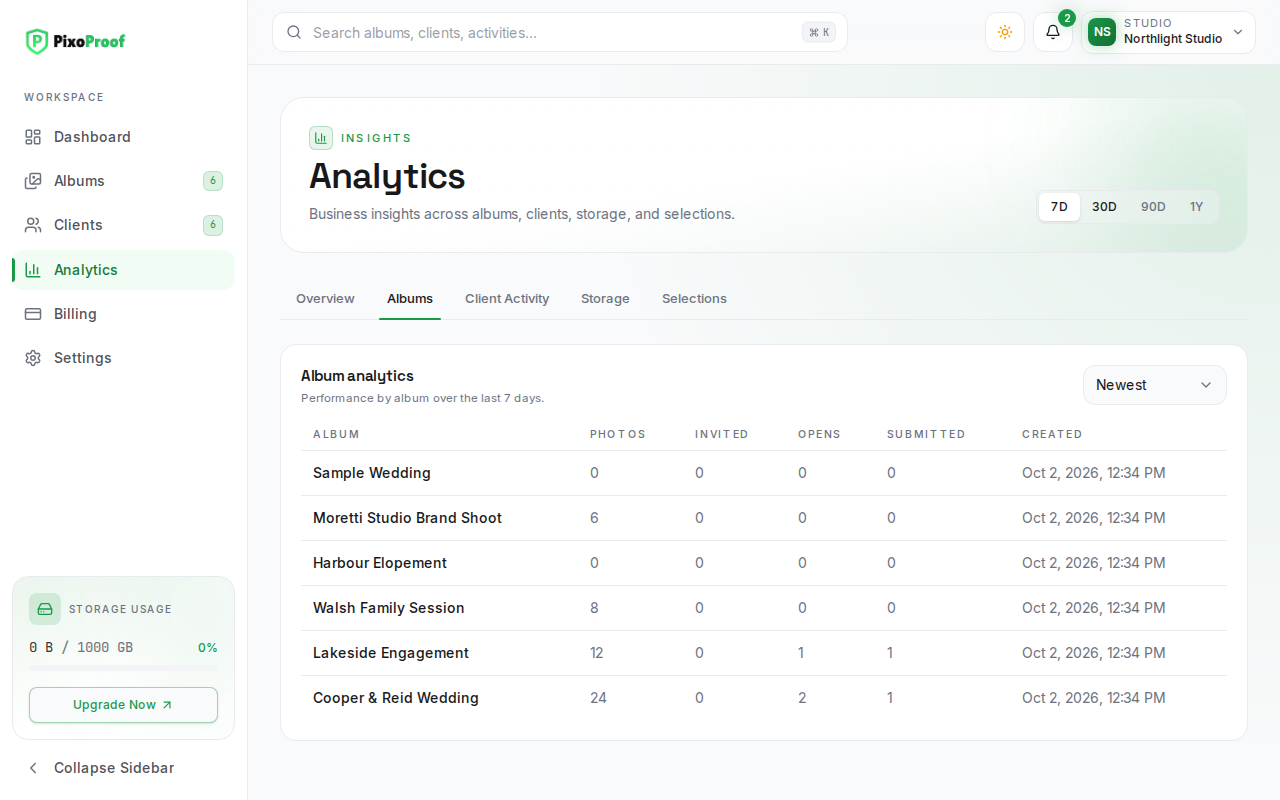
An album appears in the table if it was created during the period, or if a client was invited to it, opened it, or submitted a selection for it during the period. Archived albums are not listed.
| Column | What it shows |
|---|---|
| Album | The album name. Click it to open the album. |
| Photos | All processed photos currently in the album (not limited to the period). |
| Invited | Clients invited to the album during the period. |
| Opens | Clients who opened the gallery during the period (once per client, by their most recent visit). |
| Submitted | Selections submitted during the period. |
| Created | The date and time the album was created. |
Use the Sort albums menu to order the table by Newest (the default), Most viewed (most opens), or Most selected (most submissions). More albums load automatically as you scroll down.
Client Activity Tab
The Client activity timeline lists client events from the selected period, newest first. Each entry shows the event, the client and album name, and how long ago it happened (hover over the time to see the exact date and time).
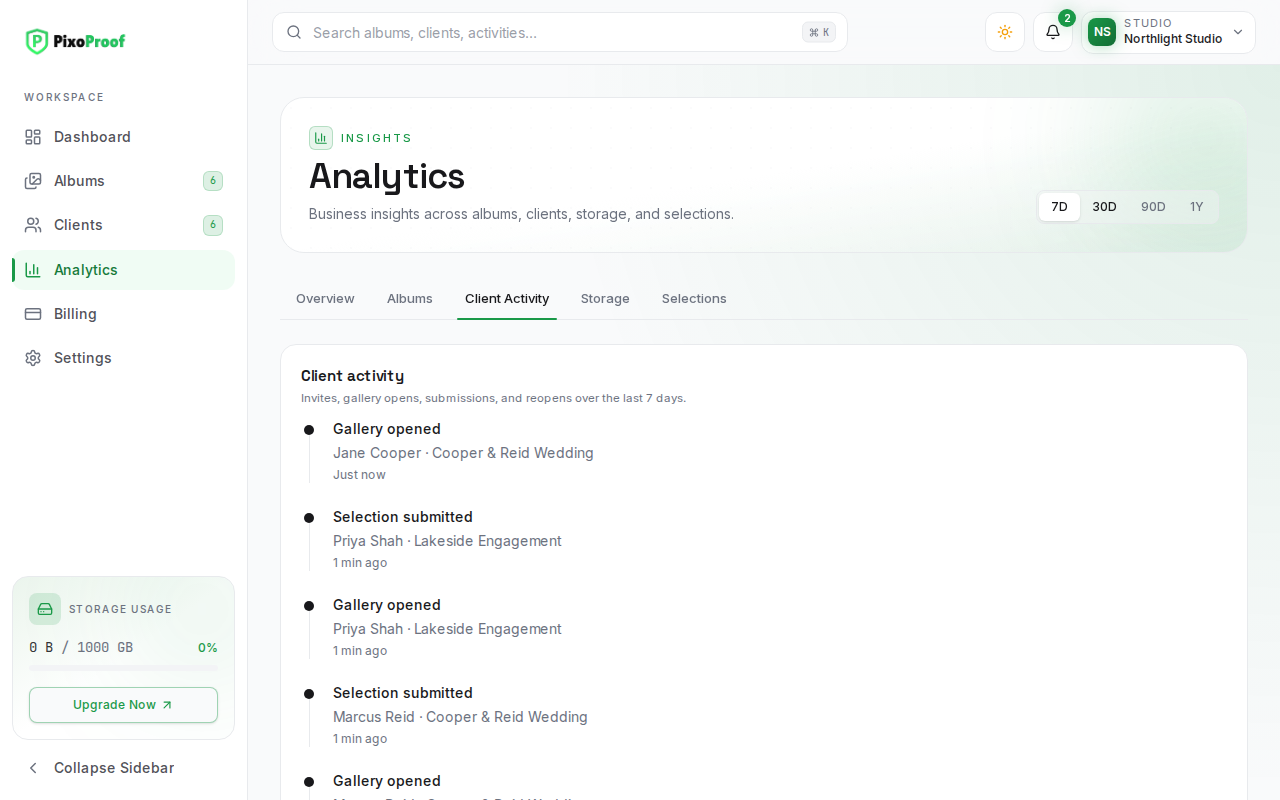
- Invite sent — a client was invited to an album.
- Gallery opened — a client opened their gallery. Only the most recent open per client and album is listed.
- Selection submitted — a client submitted their selections.
- Selection reopened — you reopened a client's submitted selection so they could make changes.
Older entries load automatically as you scroll.
Storage Tab
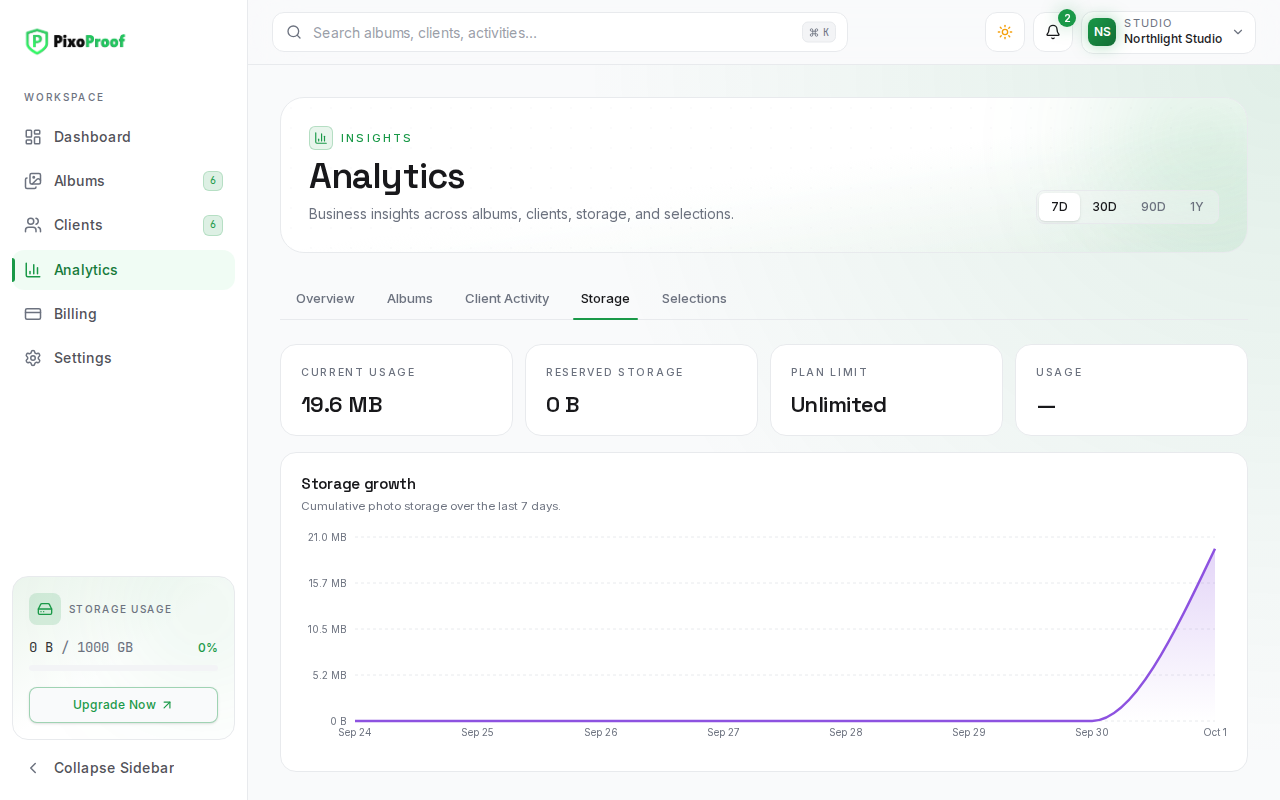
Storage Tiles
These four tiles always show your account as it is right now. They do not change with the time range.
- Current usage — the storage your photos currently use.
- Reserved storage — space set aside for uploads that are still in progress. It counts toward your plan limit until the upload finishes or expires.
- Plan limit — the storage included in your current plan, or Unlimited.
- Usage — Current usage as a percentage of your plan limit, with a progress bar. The bar turns amber from 80% and red from 95%.
Storage Growth Chart
Storage growth shows the running total size of your original photo files, day by day, across the selected period. It is built from the upload date of the processed photos that are still in your account, so photos you have deleted no longer appear in its history, and the line may not exactly match Current usage.
To raise your limit, see your plan options under Billing.
Selections Tab
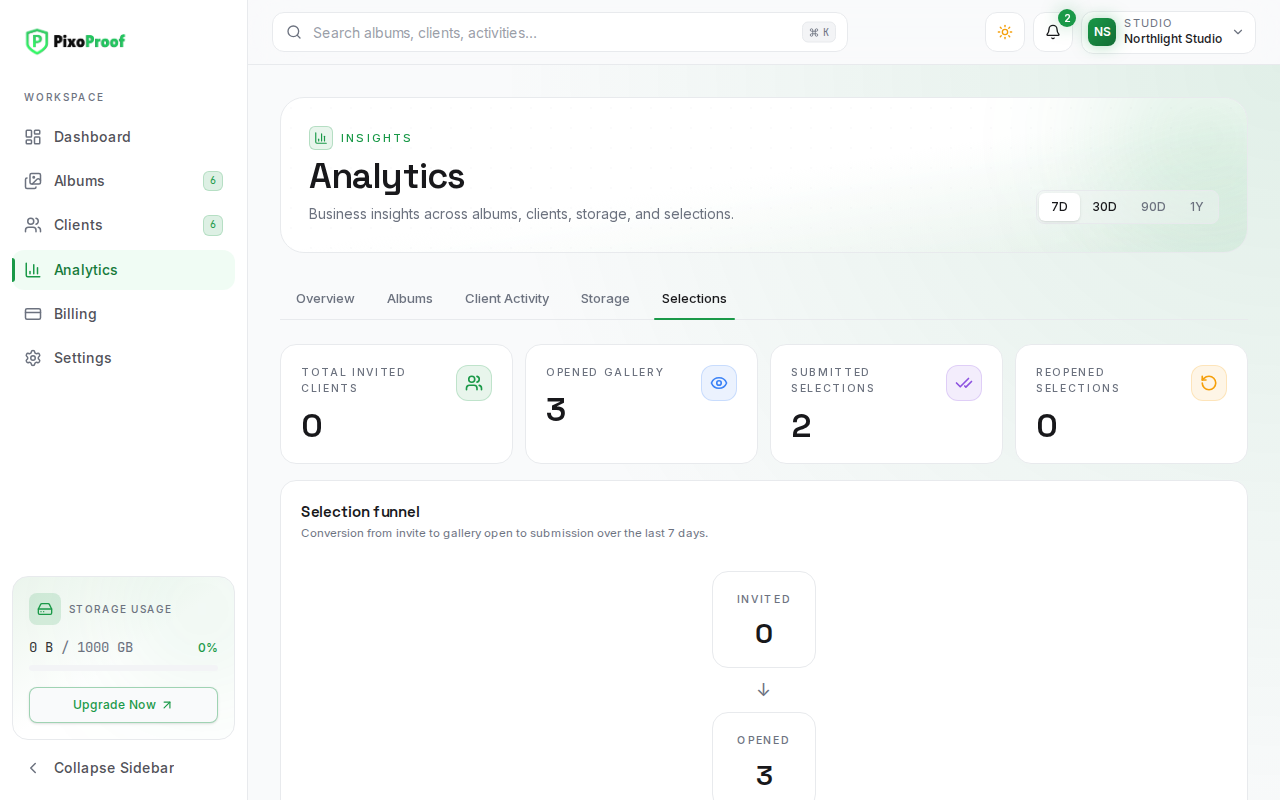
Funnel Tiles
- Total invited clients — client invitations sent during the period.
- Opened gallery — clients who opened a gallery during the period (once per client and album).
- Submitted selections — selections submitted during the period.
- Reopened selections — submitted selections you reopened during the period.
Selection Funnel
The Selection funnel shows three steps, Invited → Opened → Submitted. Under Opened and Submitted you see what percentage of the previous step reached that step (for example, "75% of previous step"). Use it to spot where clients drop off: a low Opened rate suggests clients are not receiving or acting on their invitation, while a low Submitted rate suggests they browse but do not finish choosing.
Tips
- Compare 30D with 90D to see whether gallery engagement is improving over time.
- If Selection Conversion Rate is low, check Client Activity for clients who opened their gallery but have no Selection submitted entry, and follow up with them.
- Watch the Usage bar on the Storage tab. New uploads are refused once used plus reserved storage would exceed your plan limit, so plan an upgrade when the bar turns amber.